Vertex high level architecture and principles
Cloud agnostic
Vertex is designed to be cloud agnostic, this means we do not primarily integrate with managed solutions that are specific to the a cloud provider.
Modular
Custom module / Plugins
Because the core of Vertex needs to be maintainable for the long-term it cannot have any customer specific code in its generic code, however sometimes a little bit of mapping logic or a bit of integration logic needs to be added to make Vertex work in a specific situation for a specific customer. Therefor we embrace integration points in our application using explicit plugins. This plugin system will facilitate hooks where custom process / mapping etc can be added in a maintainable way. Example of these are pricing value providers or custom actions on document types that are received into the Document Store module.
CQRS & Aggregate Root & Event sourcing
In Vertex we have a clear separation of the write side of the application from the read side of the application. We use a CQRS (Command Query Responsibility Segregation) pattern to implement this separation.
In short this means that all actions/mutations that need to be done are wrapped in a command message and published on the message bus. The command will be routed to a module that has the capability to handle that command. A command is handled by a command handler that uses an ability to create an instance of an aggregate root by replaying its history (in the form of historical events) on the aggregate root object. Using the logic in the command handler and the state of the aggregate root (containing the event-sourced write model) the implemented logic inside the aggregate root a command will be handled. This can result in a rejection where the error message is propagated to the sender of the command, or it can result in a success where the aggregate root can publish 0, 1 or more events. These events are committed to the append only event store, making it part of the history of the aggregate root and therefor part of the new write model. The events are also published on the message bus routing the event to 0, 1 or more event handlers that process the event to a read model projection, trigger other processes based on the event or trigger external integrations that need an event-driven integration.
All commands and events are provided with a reference to a specific user session, making every change in the system traceable to a specific user / service user session.
Actor system
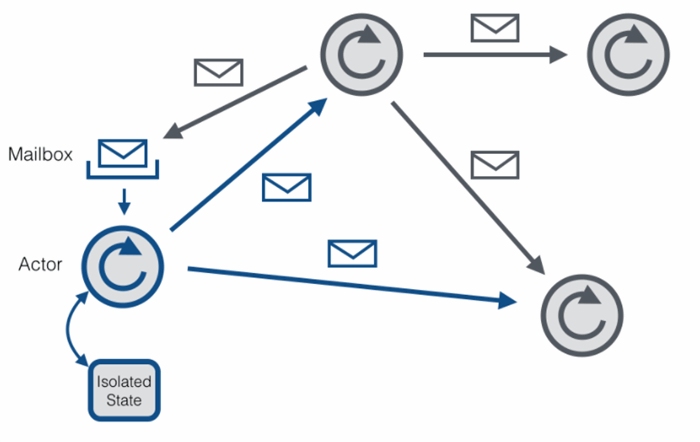
A actor is an object that contains an inbox, outbox, state and a logic loop. The actors will respond to messages that arrive in their inbox and cannot look outside their own state. They process the inputs into parts of their state and can request actions from other components in the cluster by addressing them through their outbox. It actor can only process input en look at its own state. If it requires information that is external to the actor it needs to request this information through its outbox and wait for the response on its inbox. The number of computation slots in a node are limited, and actors can be brought to sleep where their state is stored in a state store. Once re-activated their persisted state is provided and they restore their internal state. All multi-threading multi-node problems are solved by giving a single execution thread to the actor once it is activated and guaranteeing that that is the only instance of the actor running in the entire cluster.
Because the actor system is a set of mailboxes and actors an external scheduler can look at the mailboxes and calculate a metric on which the number of slots needed by the actors can be scaled. Because a new set of actor slots can be added by horizontal scaling the modules that host the actor system it works well with an application that is running on a Kubernetes solution.
By implementing the mail system in the form of a proven distributed messaging solution like Apache Kafka we can build a robust persisted messaging system between the actors.
Interfacing
Using the CQRS principles described above makes it easy to create a bespoke integration that can process any input to one or more commands that than can be send into the Vertex application as if they were created from the user input of the UI or an API call. Because they follow the same rout as every other mutation, they will also follow the exact same business logic. For sending data to other systems, we can create an event handler that pushes changes to the external system once they happen or we can create a bespoke read model that the external application can use as its data source. We also have Apache NiFi as one of our components, making it easy to read and write data from many different sources with many different protocols, have a technical translation between the messages so we can center the technical mapping logic in this layer without applying any business logic.
User interface
The Vertex User interface has a Single Page Application created in Angular. This interface has at least a CRUD interface for the entities in Vertex, but also contains process screens that help the users in their business processes. The angular application uses REST and SignalR to communicate with our backend, this means that everything that can be done with the user interface can also be done with a REST call (although for an automated process it is best to create a dedicated endpoint that operates on a need-to-know principle, sharing only as much data in/out as needed for that integration so it is a simple as possible on both sides of the integration to keep it up to date without impacting the other side).
Everything in Vertex is accessible through a web UI that has a responsive design so it can be used on mobile/tables, there are no specific clients for mobile devices at this time.
There is one exception: our Document Generation management tool needs a Word plugin, installed to a Word client (not the online version at this moment), to create its document templates. But this only to edit the templates themselves, to generate the documents once the template has been created no word is needed and all generation of the documents is done server-side without having a Word installation on the server.
While time series are available through the web ui there is also an Excel plugin available for an Excel client (not for the online version at this moment) that can retrieve the time series from Vertex. It provides a Wizard to search the time series the users want to retrieve and adds Excel worksheet functions that can retrieve time series data points over REST directly to the Excel worksheet cell (with batching of requests and local cache). This integration is based on Excel-DNA, which is an established open-source Excel integration project that does most of the heavy lifting of creating a stable addon for Excel based on the official Excel C API. Because this plugin runs as a client using the REST API it will also be available after a migration to Kubernetes.
Transparency & Traceability
Transparency and traceability: How does Vertex support transparency and traceability (audit trail, change log)
A large number of entities in Vertex are Aggregate Roots that use Event Sourcing. This means that when a domain action is applied (through a command that is linked to a user session), the internal state of the aggregate root is created from all historical events (or a snapshot for performance reasons) that are read from an append only event store. If the validations of the change pass a new event will be emitted by the aggregate root that is appended to the event store. This event is then published on the event bus for the projections to the read model to be updated. Because of this mechanism every change in the system can be analyzed, including data that would otherwise be overwritten. (for example: if you change a name twice, both events will be in the event store even though the read model will only reflect the latest name set)
Our default read model has a created/updated timestamp and user session on every record.
Our Business Rule Engine supports retrieving historical contexts so script execution can be checked in the past and tracks what inputs are used to generate an output.
We use monitoring/logging tools (CheckMK, Seq, Prometheus) to monitor the systems and check to see if there are any deviating trends in the systems incl. data retrieval.